My Life in WordsAll about information and technology
|
Install snap$sudo apt update $sudo apt install snapd $sudo apt install snapcraft Use snap$snap list Since you just install snap, there is no snaps installed on your machine. Try "snap install hello-world" as it suggested. Run snapsEach snap might include multiple related commands, with a default command that has the same name as the snap itself. Additional commands are prefixed with the snap name: $hello-world View details about installed snaps$ snap list Name Version Rev Developer Notes core 16-2 1577 canonical - hello-world 6.3 27 canonical - Check the installation directory$cd /snap/hello-world/current $ tree . ├── bin │ ├── echo │ ├── env │ ├── evil │ └── sh └── meta ├── gui │ └── icon.png └── snap.yaml 3 directories, 6 files Find snaps $ snap find compiler Name Version Developer Notes Summary ldc2 1.2.0 ldc classic D compiler with LLVM backend go 1.8.1 mwhudson classic Go programming language compiler, linker, stdlib llgo 0 axw classic llgo compiler toolchain and interpreter go14-lbo 1.4.3 lbo - Go programming language compiler part-cython 0.24.1 powersj - Optimising static compiler for Python and C go16-lbo 1.6.3 lbo - Go programming language compiler vitetris 0.57 vitetris - Console based version of Tetris rpgen v0.1.0 rgrannell1 - compile multiple scripts into a single cloud-init friendly script bcc 0.3.0-20170420-1809-e512f02 ev - BPF compiler collection
0 Comments
You must also get to know Linuxkit if you are a Docker fan like me. Linuxkit is a secure, lean and portable Linux subsystem that can provide Linux container functionality as a component of a container platform. Linuxkit project: https://github.com/linuxkit/linuxkit Linuxkit announcement: https://blog.docker.com/2017/04/introducing-linuxkit-container-os-toolkit/ Install DockerIf Docker isn't be installed on your system yet, you need install it first. If your system is Ubuntu 16.04 as mine, you can follow the steps at https://docs.docker.com/engine/installation/linux/ubuntu/. Anyway, you can verify that Docker CE or Docker EE is installed correctly by running the hello-world image. $ sudo docker run hello-world Install MobyThe Moby Project is a new open-source project to advance the software containerization movement and help the ecosystem take containers mainstream. It provides a library of components, a framework for assembling them into custom container-based systems and a place for all container enthusiasts to experiment and exchange ideas. It is announced at https://blog.docker.com/2017/04/introducing-the-moby-project/. Moby project: https://github.com/moby/moby Install moby: $go get -u github.com/docker/moby/src/cmd/moby Add moby to my PATH: $export PATH=$PATH:$(pwd)/moby/bin Start Linuxkit$cd moby/src/github.com/linuxkit/linuxkit/ $sudo moby build linuxkit.yml 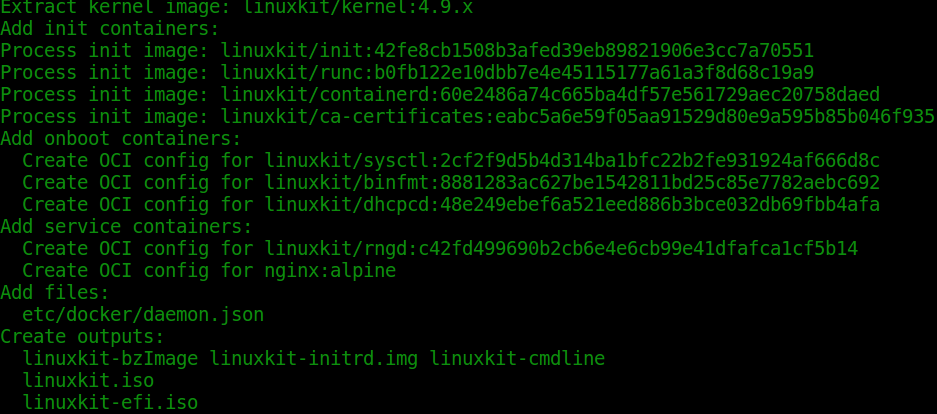 linuxkit will be producted at ../bin/ directory. $export $PATH=$PATH:$(pwd)../bin/ $linuxkit run linuxkit 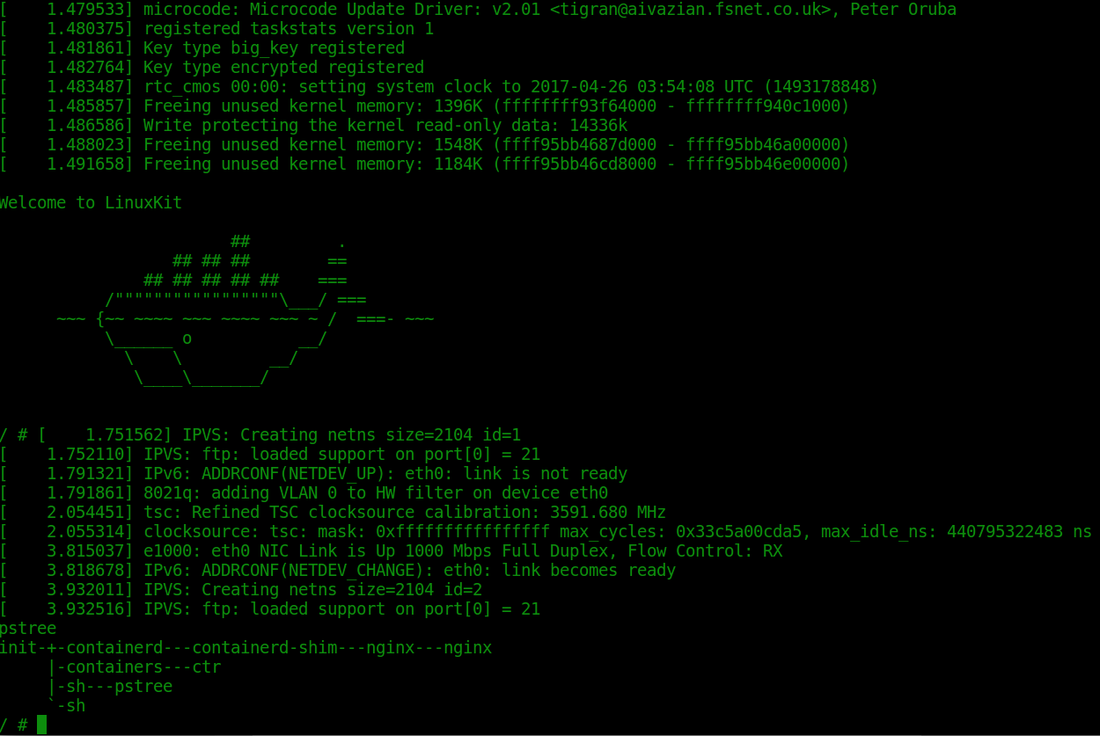 Check the process by #pstree You can check the running container by: #runc list Access containerFirst to comfirm that nigix container is running within the host's network stack. Send http request to the host. Check the configuration by runc. Run docker on LinuxkitLinuxkit is configured as read-only system. You can try to execute "touch a.c". It would prompt "touch: a.c: Read-only file system". Let's run a docker on linuxkit to replace the nginx before. Compile and start the dockerInput "halt" once you want to terminated the console. Go to the ./linuxkit/examples directory, there is a docker.yml. $sudo moby build docker.yml $linuxkit run docker Check the started container services. 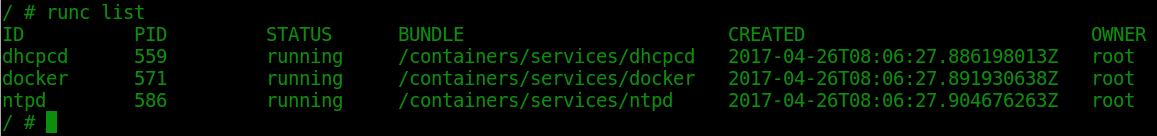 Enter docker container and check the docker information. / # runc exec -t docker sh / # docker info Containers: 0 Running: 0 Paused: 0 Stopped: 0 Images: 0 Server Version: 17.04.0-ce Storage Driver: overlay2 Backing Filesystem: tmpfs Supports d_type: true Native Overlay Diff: true Logging Driver: json-file Cgroup Driver: cgroupfs Plugins: Volume: local Network: bridge host macvlan null overlay Swarm: inactive Runtimes: runc Default Runtime: runc Init Binary: containerd version: 422e31ce907fd9c3833a38d7b8fdd023e5a76e73 runc version: 9c2d8d184e5da67c95d601382adf14862e4f2228 init version: 949e6fa Security Options: seccomp Profile: default Kernel Version: 4.9.22-moby Operating System: Alpine Linux v3.5 (containerized) OSType: linux Architecture: x86_64 CPUs: 1 Total Memory: 992.3MiB Name: moby-525400123456 ID: T4BQ:WVPV:PDA6:DNLN:NFQE:IMFY:LV6B:HXKJ:BX6R:SPEE:IUML:HA54 Docker Root Dir: /var/lib/docker Debug Mode (client): false Debug Mode (server): false Registry: https://index.docker.io/v1/ Experimental: false Insecure Registries: 127.0.0.0/8 Live Restore Enabled: false The system available space is not big. Node.js docker image that based on Alpine Linux is smaller than most distribution base images. / # df -h Filesystem Size Used Available Use% Mounted on tmpfs 496.2M 208.2M 288.0M 42% / tmpfs 64.0M 0 64.0M 0% /dev tmpfs 496.2M 208.2M 288.0M 42% /lib/modules tmpfs 496.2M 0 496.2M 0% /sys/fs/cgroup tmpfs 496.2M 208.2M 288.0M 42% /var/lib/docker tmpfs 496.2M 208.2M 288.0M 42% /var/lib/docker/overlay2 / # docker run --rm -it node:7.9-alpine sh Unable to find image 'node:7.9-alpine' locally 7.9-alpine: Pulling from library/node 709515475419: Pull complete 278538de9ce7: Pull complete 732a325308f5: Pull complete Digest: sha256:aa698f64736e0a8ae1c4d8ffaf62fc82fc81a2140d3f1c8d1457f9e491b1b444 Status: Downloaded newer image for node:7.9-alpine [ 676.758049] docker0: port 1(vethcc8cc58) entered blocking state [ 676.758811] docker0: port 1(vethcc8cc58) entered disabled state [ 676.759352] device vethcc8cc58 entered promiscuous mode [ 676.761749] IPv6: ADDRCONF(NETDEV_UP): vethcc8cc58: link is not ready [ 676.781115] IPVS: Creating netns size=2104 id=6 [ 676.781654] IPVS: ftp: loaded support on port[0] = 21 [ 676.865002] eth0: renamed from veth50565d4 [ 676.865565] IPv6: ADDRCONF(NETDEV_CHANGE): vethcc8cc58: link becomes ready [ 676.866160] docker0: port 1(vethcc8cc58) entered blocking state [ 676.866645] docker0: port 1(vethcc8cc58) entered forwarding state [ 676.867207] IPv6: ADDRCONF(NETDEV_CHANGE): docker0: link becomes ready  You can try more on Linuxkit.
First, you need make your system full updated.
I used GCC 5.0. It complained on multiple definition of some string-related functions when link 400.perlbench, like here: https://vmakarov.fedorapeople.org/spec/spec2006.toolbox/gcc/log/20150117/747.log For this particular issue, it is caused by GCC 5 that has moved to a new default C standard. Add "-std=gnu89" to CPORTABILITY flags of perlbench solved it.
Sometime you want to rebuild a package on Ubuntu, here are the steps you need to do at your system:
$sudo apt-get build-dep gcc $dpkg-source -x gcc*.dsc $dpkg-buildpackage -us -uc This will do everything to make full binary and source packages for you. GDB provide several ways to check registers when you debug a programme with GDB.
我们在做GCC开发的时候,常常需要只运行指定的测试用例。只运行部分测试用例,你可以用命令“make check-gcc”、“make check-c”以及”make check-c++”等等。你还可以用RUNTESTFLAGS添加更多的参数来指定更具体的测试用例。比如:
make check-gcc RUNTESTFLAGS=“atomic.exp=c11*” 更多相关知识可以参考GCC官方文档。 https://gcc.gnu.org/wiki/Testing_GCC https://gcc.gnu.org/install/test.html https://gcc.gnu.org/onlinedocs/gccint/Makefile.html When build gcc or run commands that need a long time, it's better to keep job running in background after exit the terminal. Most of the time, I will login into remote server by ssh. The command nohup can help to keep the job running in background.
nohup is a POSIX command to ignore the HUP (hangup) signal. The HUP signal is, by convention, the way a terminal warns dependent processes of logout. For example: $nohup make -j12 &>/dev/null & This will execute make -j12 even if the terminal that started this command is disconnected or closed. 在这里我将通过调试一个GCC前端的bug,介绍怎样用gdb调试GCC。 这是一个GCC bugzilla上的一个bug: https://gcc.gnu.org/bugzilla/show_bug.cgi?id=78987 非常明显,这是由于location定位不对而导致的diagnostic messages显示不准确。 去优化加调试信息 输出这条诊断信息的源代码如下图所示,它所在的文件是gcc/c-family/c-common.c。为了方便调试,我们可以重编译它。 If you have a fully bootstrapped build and you want to recompile only some files, you can do: $ touch $GCC_SRC_DIR/gcc/c-family/c-common.c $ cd gcc/ && make CXXFLAGS="-g3 -O0" 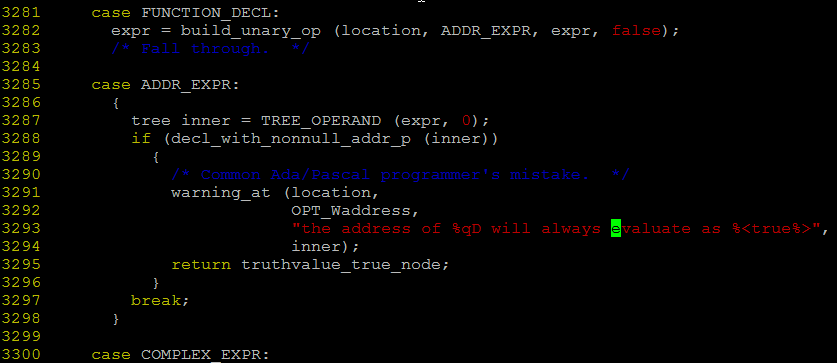 被调试的程序 "GCC is composed of a driver program (gcc, g++, gfortran, etc.) that calls the compiler itself (cc1, cc1plus, f951, etc.), the assembler (as) and the linker (ld or collect2). There is a compiler for each language. Most often, one wants to debug the compiler itself instead of the driver." Use gcc -v will get the exact command sequence. 在这里我们要调试的编译器是cc1。 测试用例 我们的测试用例是78987.c,用下面的命令得到确切的命令序列。 $./xgcc -B. -v ~/project/myproject/78987.c -c -Wall 制作一个gdbfile 下面就可以创建一个文件,把要要调试的文件、断点、要启动的测试用例等信息记录下来,这样当你修改了gcc代码进行调试的时候,不必每次都手动设置 ----------------------------- file ~/gcc_src/build/gcc/cc1 break c-common.c:3284 run -quiet -v -imultiarch x86_64-linux-gnu -iprefix /home/shujing/gcc_src/build/gcc/../lib/gcc/x86_64-pc-linux-gnu/7.0.1/ -isystem ./include -isystem ./include-fixed /home/shujing/project/myproject/78987.c -quiet -dumpbase 78987 .c -mtune=generic -march=x86-64 -auxbase 78987 -Wall -version -o /tmp/cc33An5m.s ------------------------------ 执行 $gdb -x gdbfile 调试 第一次停留的断点输出的诊断信息的位置是正确的,我们要调试的是第二次输出,所以继续 (gdb)c (gdb)bt 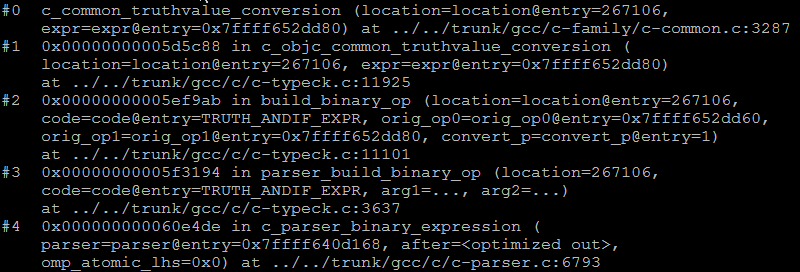 从backtrace函数调用栈,我们可以清楚的看到 location信息是由c_parser_binary_expression传递给parser_build_binary_op。所以解决这个bug就可以从分析c_parser_binary_expression开始。
参考资料 关于使用GDB调试GCC,gcc.gnu.org上有很好的官方文档 https://gcc.gnu.org/wiki/DebuggingGCC 这里也分享了很不错的经验,但是应该是针对较早版本的GCC,因为此文中采用的是 make CFLAG='-O0 -g3',而现在GCC已经采用g++编译。 http://www.cs.rochester.edu/twiki/bin/view/Main/CS255Spring09DebugCC1 sar(System Activity Reporter系统活动情况报告)是目前 Linux 上最为全面的系统性能分析工具之一,可以从多方面对系统的活动进行报告,包括:文件的读写情况、系统调用的使用情况、磁盘I/O、CPU效率、内存使用状况、进程活动及IPC有关的活动等。下面介绍下本人如何用sar来监控高负载运行下Ubuntu 16.04系统。
安装 $sudo apt-get install sysstat 配置 编辑 /etc/default/sysstat 把 Enabled="false” 改成 Enabled="true” /etc/cron.d/sysstat 为一个定时作业的格式编写的,我们可以自己调整它的执行时间间隔。默认的设置是10分钟收集一次,可以把收集间隔改为2分钟 5-55/10 * * * * root command -v debian-sa1 > /dev/null && debian-sa1 1 1 改为 */2 * * * * root command -v debian-sa1 > /dev/null && debian-sa1 1 1 重启服务 $service sysstat restart 运行 本机正在编译gcc,看看有没有什么系统资源的使用情况. 执行命令的最后两个数字参数前一个表示interval, 后一个表示count, 2 2 表示每2秒钟采样一次,共采样两次。可以根据需要调整这两个数据。 $sar -n DEV 2 2 用来显示网络接口信息,从显示的信息看,此机的网络资源使用机会是0%。 $sar -r 2 2 可以用来查看内存的使用情况 $sar -B 2 2 可用来监控内存分页 $sar -d -p 2 2 可以用来查看磁盘设备的活动情况 $sar - u ALL 2 2 可以用来查看CPU的使用情况 $sar -P ALL 2 2可以查看每个CPU的使用情况,如果负载分配不平衡可以尝试均衡分配。 $sar -b 2 2 可以用来进行I/O和传送速率监控 $sar -q 2 2 可以进行进程队列长度和平均负载状态监控 $sar -W 2 2 可以用来查看系统交换活动信息监控 系统性能瓶颈判断
这些工具可以和vmstat、iostat结合起来进行系统性能分析和性能瓶颈判断。 |
AuthorThis is a blog that is about my works on Benchmarking Performance, Compiling Optimization, Optimize Compile, Parallel Programming, Virtualization, Container, Docker, Moby, Linuxkit, Open Source and any others. Archives
August 2018
Categories |
 RSS Feed
